Mark relative strength by hand
You draw comparison lines between sector ETFs and the broad index on weekly printouts. The instructor walks the room while you work, correcting angle and anchor points before habits set in.
Portal Redwood Hub runs small-group chart workshops where equity traders mark relative strength lines, compare sector ETFs, and build rotation watchlists using printed panels — the way many Bangkok desks still prepare each week.

Sessions follow a workbook structure: one sector panel per page, pencil annotations, and group review — not screen-sharing marathons.
You draw comparison lines between sector ETFs and the broad index on weekly printouts. The instructor walks the room while you work, correcting angle and anchor points before habits set in.
Each trader leaves with a one-page panel listing sectors to monitor, the symbols used in class, and blank space for the next two weeks of notes.
Afternoon chart circles let you explain your markings to peers. Hearing how others phrase a rotation shift often clarifies what your own chart was trying to say.
Reserve a seat for the flagship full-day workshop or join a shorter weekly circle.
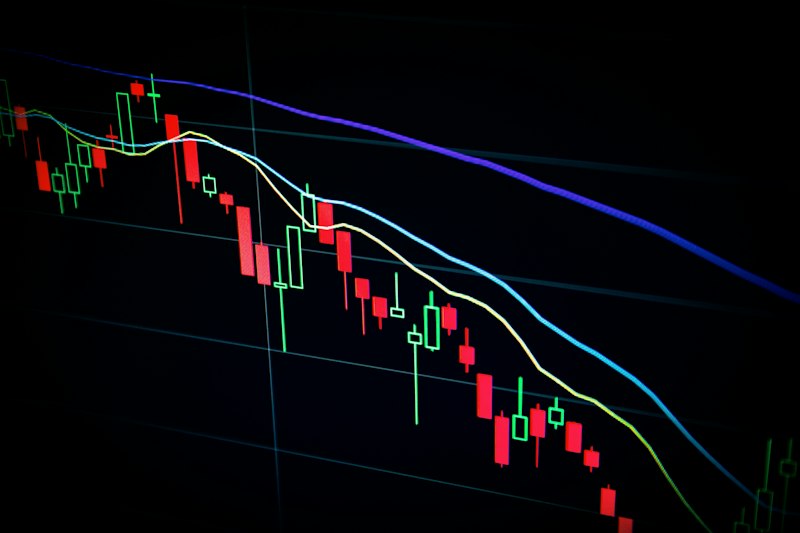
A full-day, hands-on session mapping sector leadership shifts on weekly and daily charts, with printed workbooks and live mark-up exercises.
Read full description
A recurring 90-minute group session where traders bring marked weekly charts and discuss rotation cues under guided facilitation.
Read full description
One-on-one review of your sector rotation annotations, relative strength lines, and watchlist construction with written feedback notes.
Read full descriptionThe workbook forced me to slow down. I had been flipping between sectors on screen every few minutes; marking one panel per sector on paper made the laggards obvious by lunch.
— Pawit L., attended Sector Rotation Workshop, February 2026
Chart circle was useful, though I wish we had ten more minutes on Thai banking vs property comparison. Still, hearing three different traders describe the same relative strength cross helped more than another video.
— Mei C., Weekly Chart Study Circle regular
Short guides from our instructors on rotation chart technique.
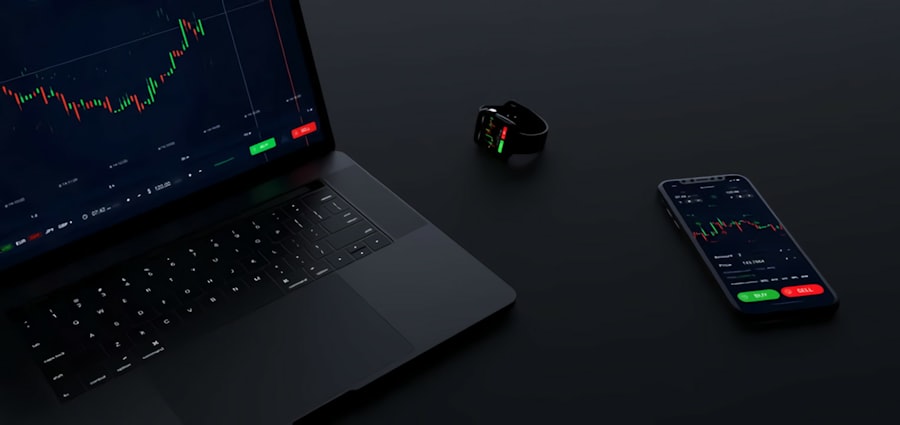
How to annotate weekly charts when one sector ETF begins outperforming the broad index — without waiting for headline news.
Read article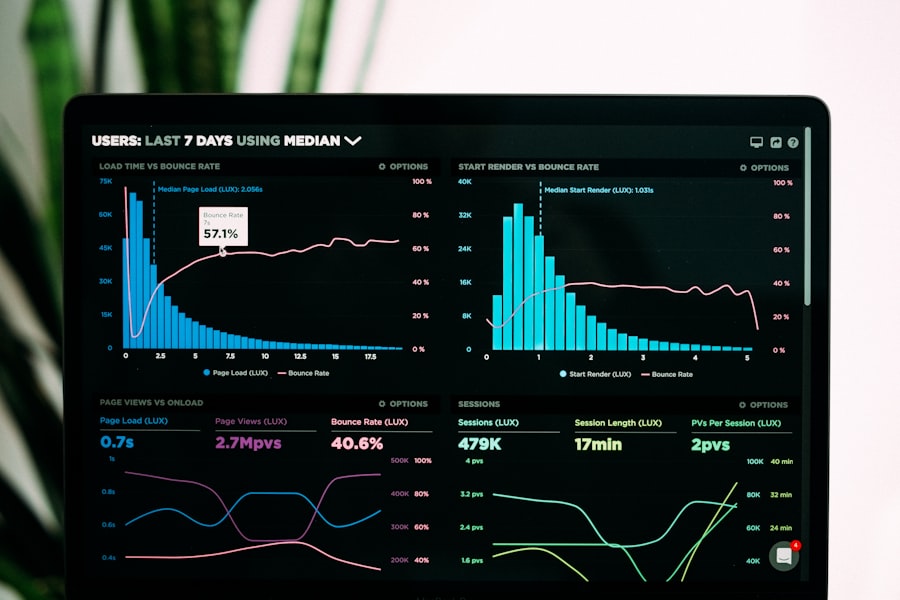
Which sector symbols to track on the SET, how many lines belong on one page, and when to retire a name from your panel.
Read article
Mixing timeframes on one panel, ignoring volume context, and chasing lagging sectors — patterns we see in every new cohort.
Read article